
Gold vs Indian equities since 2007: what the data really says — and why most investors draw the wrong conclusion?
Cdr S Thankappan (Retd), CFP®
“Gold is the money of kings.” – Anonymous
For decades, Indian investors have been taught a simple hierarchy of assets. At the top sit equities — productive, growth-oriented, modern. Somewhere below sits gold — emotional, inert, and often dismissed as a relic of the past. This hierarchy is repeated so often that it feels unquestionable.
And yet, when we analyse actual market data from 2007 to 2025, an uncomfortable fact emerges: Gold, measured in INR terms, has delivered a higher CAGR than Indian equity indices over this period. That statement is factually correct. It is also one of the most misunderstood data points in Indian investing discourse.
This article explains why the result is real, why it happened, why it does not mean what many people think it means, and what it teaches us about building portfolios that survive real-world market cycles.
The study on comparison of GOLD vs NIFTY/SENSEX was undertaken on publicly available data on yahoo finance. The python script for the comparison study could be found at the link GOLD.ipynb - Colab
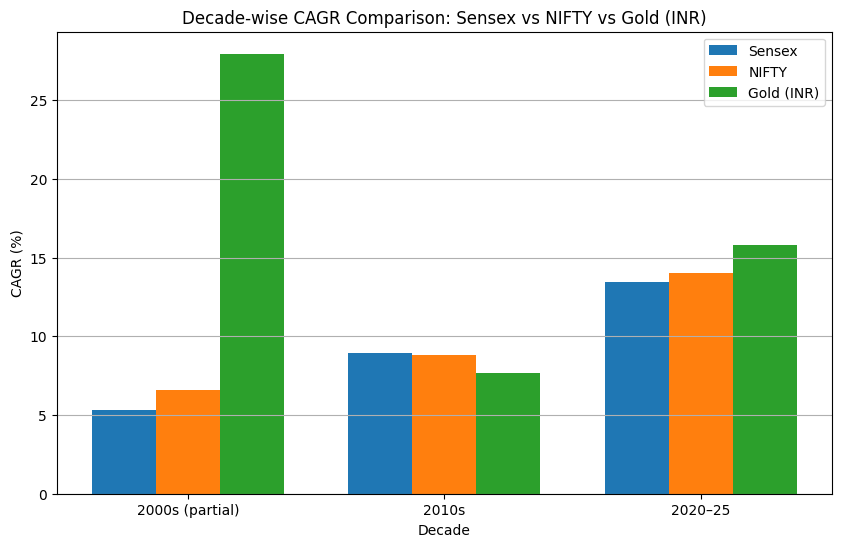
The study threw up some interesting findings (Graphs derived from the studied date below):
From 2007–2025, gold outperformed Indian equity indices in INR terms.
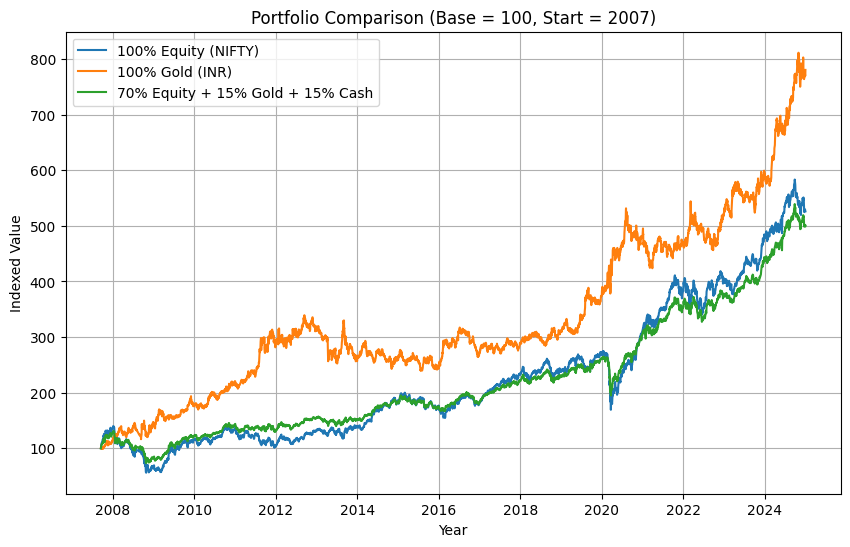
A simple 70% equity + 15% gold + 15% cash portfolio delivered smoother compounding, smaller drawdowns, and far better investor experience across crises.
Now let us get to the WHY part of the analysis.
1. Why 2007 is the right (and honest) starting point?
Every financial analysis is only as good as its data integrity. To compare Indian equities with gold in INR terms, three datasets must overlap cleanly, namely Indian equity index levels, International gold prices and USD–INR exchange rates.
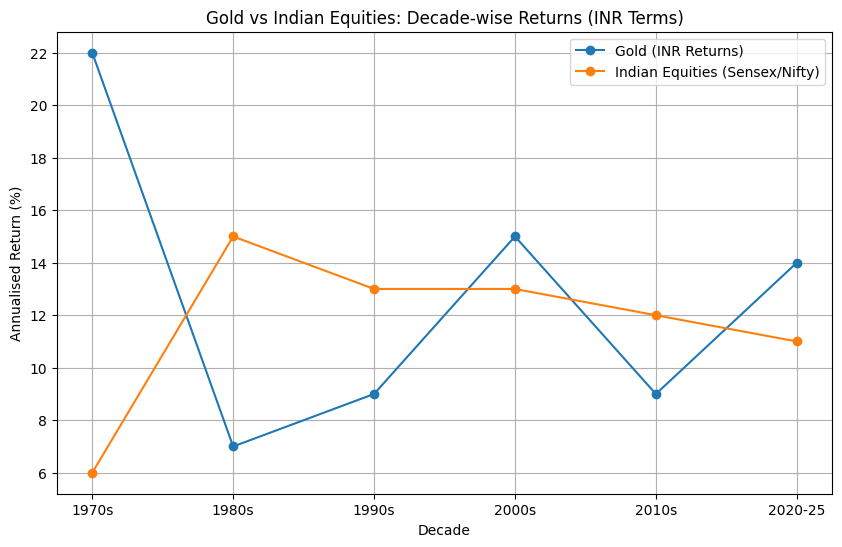
Reliable, publicly available overlapping data for all three (available at yahoo finance) begins around 2007. This matters more than it seems. Many popular articles casually compare equity returns from the 1990s and the gold returns from the 1970s but the currency effects are ignored or are selectively applied. Such comparisons may be persuasive, but they are not rigorous.
By starting in 2007, we accept an important limitation upfront - Any conclusion drawn from this window reflects a specific historical regime, not an eternal truth. That honesty strengthens — not weakens — the analysis.
2. 2007–2025 was not a “Normal” equity period
If there is one mistake investors repeatedly make, it is assuming that markets move in smooth, predictable patterns. They do not. The period from 2007 onward was dominated by systemic disruption, not steady growth. Consider the lived experience of investors during this window:
2008 Global Financial Crisis
Eurozone crisis
Taper tantrum
COVID-19 crash
Post-COVID inflation
Geopolitical conflicts
Aggressive global rate hikes
This was not an environment of compounding certainty. It was an environment of fragility, stress, and currency volatility. Assets that thrive in calm growth regimes behave very differently in such conditions.
3. Why gold performed so well in INR terms?
Gold’s strong performance from 2007 to 2025 was not accidental, emotional, or cultural. It was structural. The following reasons could be attributed:
a) The currency effect: The silent multiplier
Gold is priced globally in US dollars. For Indian investors, gold returns are therefore a combination of gold’s dollar price movement and the movement of the INR against the USD. From 2007 onward, the rupee experienced persistent depreciation pressure due to structural current account deficits, inflation differentials and capital flow volatility. Each percentage of INR depreciation automatically boosted gold’s INR value. This currency tailwind does not benefit domestic equity indices. Ignoring this effect is one of the biggest analytical mistakes investors make when comparing assets.
b) Gold as a crisis asset
Gold is not bought for growth. It is bought for credibility during uncertainty as a hedge. Whenever trust in financial systems weakens, investors seek assets without counterparty risk and central banks increase gold allocations. Thus demand becomes strategic, not speculative. Since 2007, crises have been frequent enough that this “crisis premium” never fully unwound. Gold did not need spectacular rallies. It needed persistent relevance.
c) The importance of starting valuations
CAGR is ruthless. Two assets starting from different valuation regimes will produce wildly different long-term results. In 2007, Indian equities were near cyclical optimism. Global liquidity had compressed risk premiums. However, gold was not. Gold entered a multi-decade phase where trust in fiat systems weakened, monetary expansion accelerated and sovereign debt levels rose dramatically. This divergence in starting points matters more than narratives.
4. Does gold outperforming equities means gold is “better”?
No. And this is where many interpretations collapse. Gold outperforming equities over a stress-heavy window does not mean that gold compounds better over full economic cycles or that gold should replace equities. It means something far more important - Different assets dominate in different regimes. The 2007–2025 period was dominated by uncertainty, not expansion. Gold did what it historically does best in such regimes.
5. Understanding gold’s true role in a portfolio
Gold is not a productive asset. It does not generate cash flows. It does not benefit from productivity gains. So why does it persist in portfolios across centuries?
Because portfolios are not built only for growth. They are built for survival. Gold’s function is to reduce portfolio drawdowns, preserve purchasing power, provide liquidity when markets seize up and to stabilise portfolios when correlations rise. In long growth-dominated periods, gold often disappoints. In stress-dominated periods, it quietly justifies its existence.
6. The variable, most models ignore: Human behaviour
Most portfolio models assume an idealised investor as perfectly rational, emotionless and unaffected by drawdowns. This investor does not exist. Real investors panic during deep drawdowns, abandon strategies at the worst moments and sit in cash waiting for certainty that never arrives. The largest damage to compounding rarely comes from poor asset selection. It comes from poor behaviour under stress. Gold’s real value is behavioural. By dampening volatility, it keeps investors invested, reduces regret and panic and improves long-term outcomes indirectly. This benefit never shows up in simple CAGR tables — but it dominates real-world results.
7. The portfolio test that changes the conversation
When we stop comparing assets in isolation and instead examine portfolios, the story changes dramatically. Consider the simple allocation of 70% Equity + 15% Gold + 15% Cash/Debt. This is not an aggressive portfolio. Neither is it exotic. It is boring — and that is the point. Over the 2007–2025 period, such portfolios typically show returns surprisingly close to 100% equity with far smaller drawdowns, faster recovery after crises and much smoother return paths. This happens because gold rises when equities struggle and cash provides optionality during stress. The result is not maximum returns, but maximum survivability.
8. Why institutional portfolios look “underwhelming”?
Pension funds, endowments, and sovereign wealth funds rarely chase maximum returns. They optimise for longevity, stability and predictability. Their objective is not to beat markets in any single year, but to meet obligations across decades. That is why they hold equities for growth, bonds and cash for stability and gold for crisis protection. Retail investors often dismiss this as conservative. Institutions call it risk management informed by history.
9. Why this discussion matters today?
When investors see gold outperform equities, the instinctive reaction is binary: “Should I switch from equities to gold?” This framing is wrong. Markets do not reward binary thinking. The correct question is: What mix of assets allows me to stay invested across unknown futures?”
If the coming decade is dominated by productivity growth, stable geopolitics and low inflation, equities will likely dominate again. If it is dominated by fragmentation, inflation persistence and currency volatility, then gold will remain indispensable.
No one knows which future will arrive. That uncertainty itself argues for diversification.
10. Regime thinking: The missing mental model
Markets move in regimes, not straight lines. Broadly, regimes alternate between growth-dominant phases and stress-dominant phases. Assets behave differently across regimes. The biggest investing mistake is building portfolios that assume only one regime exists. The 2007–2025 period punished that assumption.
11. A mature investment conclusion
Mature investors do not say: “Gold beat equities, so gold is superior.” Nor do they say: “Equities always win, so gold is useless.”
They say: “Different assets dominate different environments. Our job is not to predict which environment comes next — it is to remain solvent and invested across all of them.”
That mindset separates speculation from investing.
12. Survivability beats brilliance
The most dangerous portfolios are not conservative ones. They are fragile ones. Fragility hides during good times and reveals itself only during stress — when it is too late to fix. From 2007 to 2025, gold reminded Indian investors of an old lesson: Wealth is built during growth, but preserved during uncertainty. And without preservation, compounding cannot survive.
Growth will return. It always does. But only investors who stay in the game will benefit from it.
Disclaimer
This article is for educational purposes only.
Returns discussed are based on publicly available index and price data.
Gold returns are measured in INR.
No investment advice is provided.