
Outlook for Indian Markets on the 77th Republic Day
Cdr S Thankappan (Retd), CFP®
As India celebrates its 77th Republic Day, it is an opportune moment to reflect on the economic journey ahead. Over the past decade, India has moved from being a high-potential emerging economy to a systemically important growth engine for the world. The economy has graduated from chronic scarcity to structural abundance in several areas like foreign exchange reserves, food production, digital infrastructure, and entrepreneurial capacity. India enters 2026 with notable macro stability despite global uncertainties such as geopolitical tensions, fragmented supply chains, and tight financial conditions. India remains among the fastest-growing large economies, driven by domestic consumption, services exports, and an active public capital expenditure program.
The size of economy
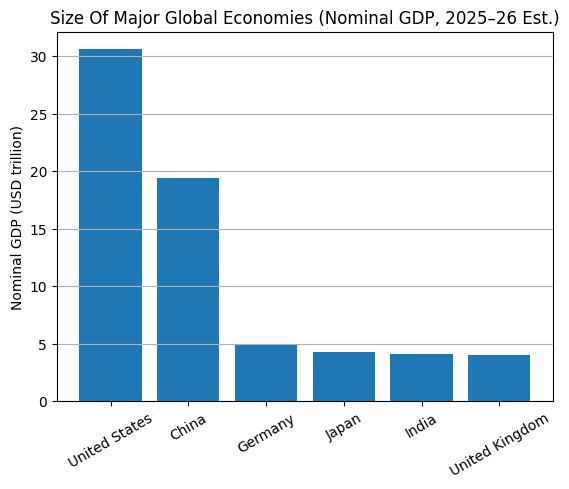
Size of Economies
United States and China dominate global GDP, together accounting for nearly half of world economic output. India’s economy (~$4.5 trillion) has moved ahead of Japan and the UK in nominal GDP rankings to become the 4th largest economy in the world. Projections suggest India could overtake Germany to become the 3rd largest in the coming years.
Note: The available data from World bank is dated and therefore the charts below show India at the fifth position.
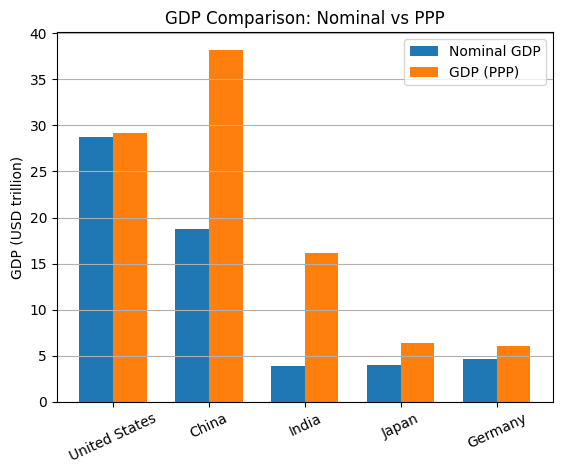
GDP : Nominal vs PPP
While, Nominal GDP shows economic size at market exchange rates (global financial power), the PPP GDP adjusts for cost of living and domestic purchasing power (real economic weight). A comparative study of the GDP in PPP terms throws a completely different picture. The Nominal GDP ~ $4+ trillion; PPP GDP ~ $15+ trillion.
This gap highlights India’s true internal scale and growth potential. On a nominal basis, India is already among the world’s top economies. On a PPP basis, India is firmly a global economic heavyweight. As we mark the 77th Republic Day, this chart reminds us that India’s real strength lies not just in size, but in the depth of its domestic market and long-term growth runway. The python script used in the analysis is shared at Economy.ipynb - Colab
Indian Markets
Over the last two decades, India’s markets have matured markedly: deeper equity markets, more sophisticated fixed income instruments, a rapidly growing mutual fund industry, and a digital payments architecture that accelerates liquidity and participation. These structural improvements matter because they determine not only the quantum of investment but its quality and durability.
Valuation Landscape. Indian equities have delivered impressive returns over the past decade, driven by earnings growth and multiple expansion. While the valuations may appear stretched by historical standards, the heterogeneity across sectors is pronounced. While some large-cap quality names trade at premium multiples justified by growth and margins, cyclical and non-performing sectors still trade at discounts.
Investor Base and Flows. A secular shift in the investor base is underway. Domestic institutional investors, i.e. mutual funds and insurance companies have increased participation, reducing the relative dominance of foreign portfolio investors (FPIs). Retail participation, aided by digital brokerages and direct mutual fund platforms, has also risen. This diversification of holders increases market stability.
What the Yield Curve Indicates
In simple terms, the yield curve shows what the bond market believes about the future of an economy. The yield curve plots interest rates (yields) against time (maturity) for government bonds. From this one line, markets infer growth, inflation, risk, and policy credibility.
Note: Yield data has been sourced from US Treasury, ECB/Bundesbank, RBI/CCIL and Chinabond portal. Compiled for comparative macro analysis.
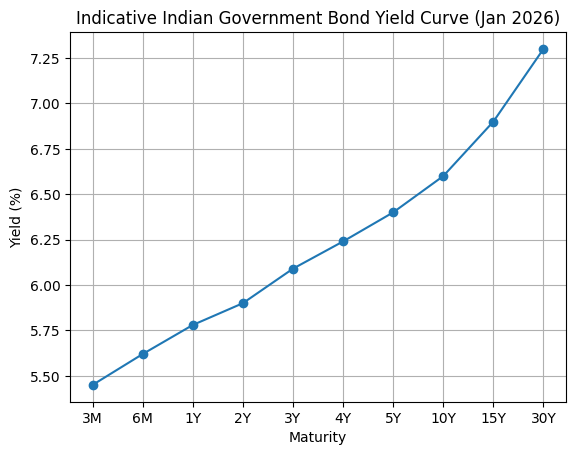
Key takeaways from the yield curve (India)
Normal upward slope: Shorter-maturity yields are lower than long-term yields, suggesting markets expect moderate growth with some inflation risk over time. This is a classic “normal” curve. 10-year benchmark is around ~6.6-6.7%. Longer yields are above 7%.
This normal curve tells us that our economy would continue to grow.
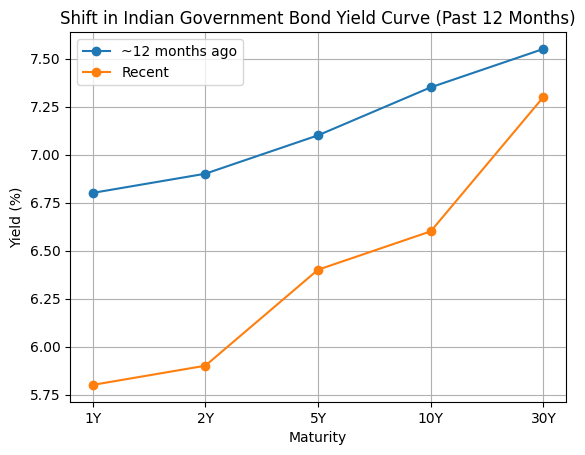
Key insights from the curve shift over the last year (India)
Broad downward shift (bullish for bonds). Yields across maturities are lower today than a year ago, especially at the short and medium end.
This reflects an easing of inflation, softer monetary policy stance and improved liquidity conditions.
Steepening at the long end. While 1–5-year yields have fallen sharply, the 30-year yield remains relatively elevated.
This suggests markets still price long-term fiscal supply, inflation risk premium and term premium for holding very long bonds.
Key insights from yield curves of major economies
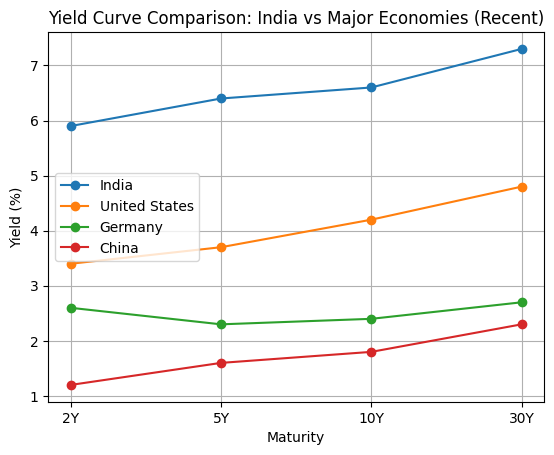
India. The curve is highest across all maturities and clearly upward sloping. It indicates that the markets demand a higher return to lend long-term to India. This reflects stronger growth expectations and premiums for developing market and for inflation, thus pointing towards an emerging economy with structural growth.
United States. Flatter curve and lower yields than India, but higher than Germany/China. Since the curve is relatively flat especially between 5yr and 10yr, the markets expect slower growth.
Germany. Low and flat curve with very low yields across the curve. It reflects weak growth expectations and anchored inflation. It offers limited return potential, but high stability.
China. Low yields but upward sloping. It indicates monetary easing bias and growth support via policy. China’s bond market is a policy instrument, not a pure market signal.
On this Republic Day, the Indian economy reflects the maturity of the republic itself: resilient, ambitious, and increasingly consequential. The next chapter of India’s economic story will be written not just by policymakers, but by entrepreneurs, workers, and citizens who embody the constitutional promise of opportunity.
A confident republic now faces its most important task: turning potential into prosperity for all.